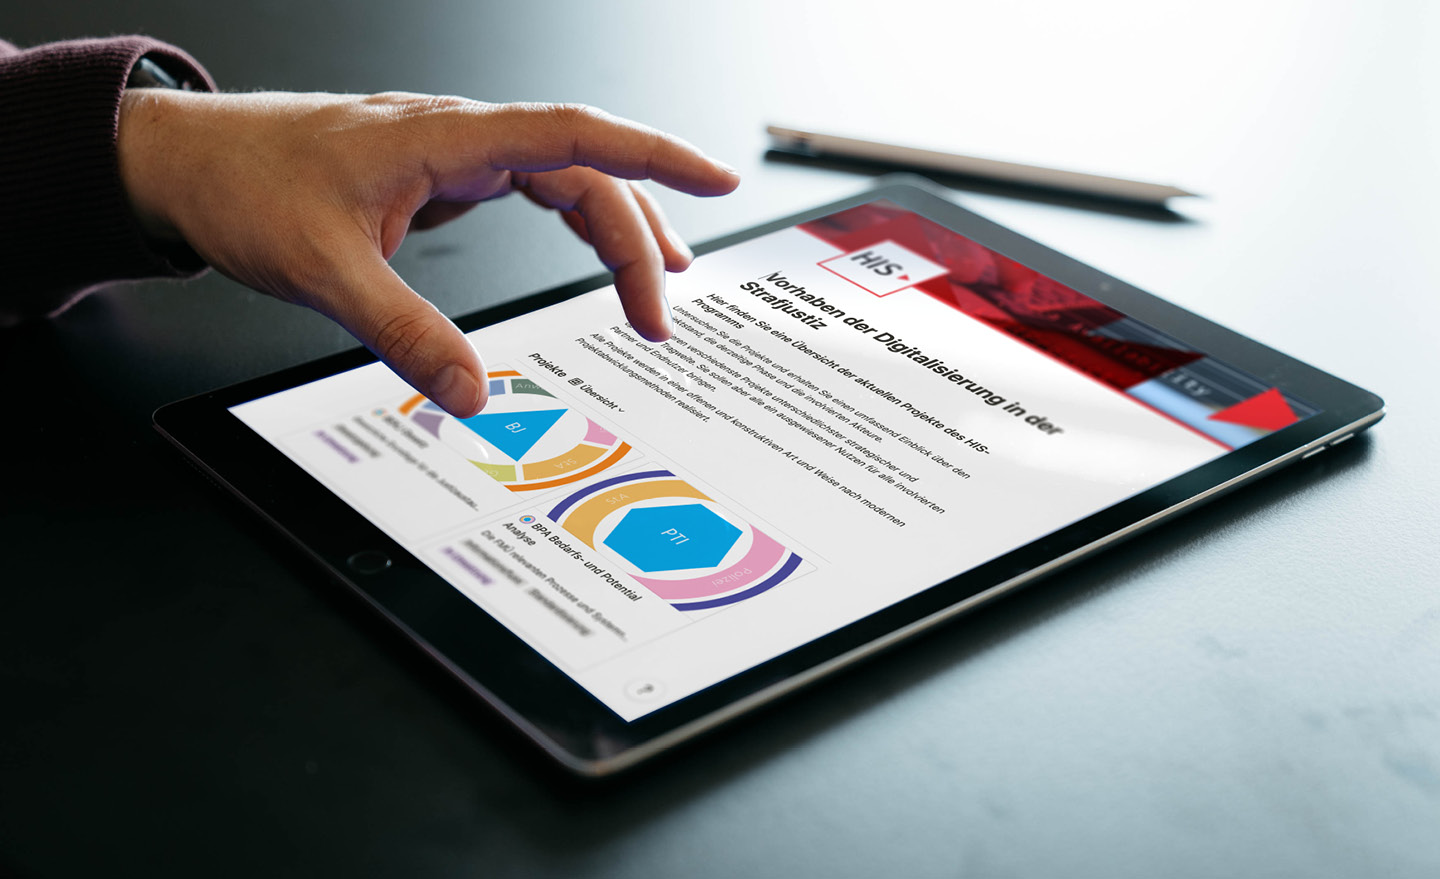
Data visualization for advanced projects
Ambition
HIS is engaged in complex projects with various parameters, states, dependencies and responsibilities. It is difficult to get an oversight of the information, because in the preparation of the data the correlations and information density are not decipherable.
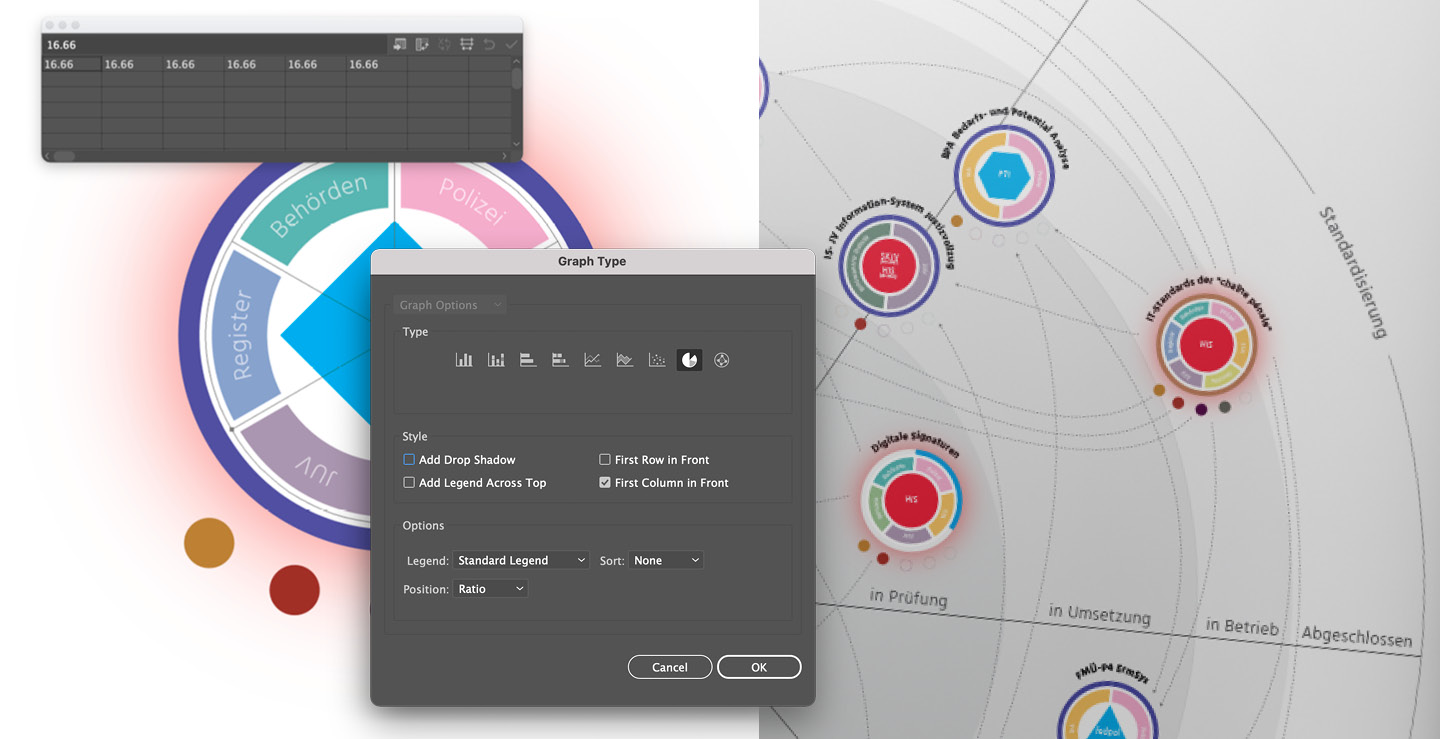
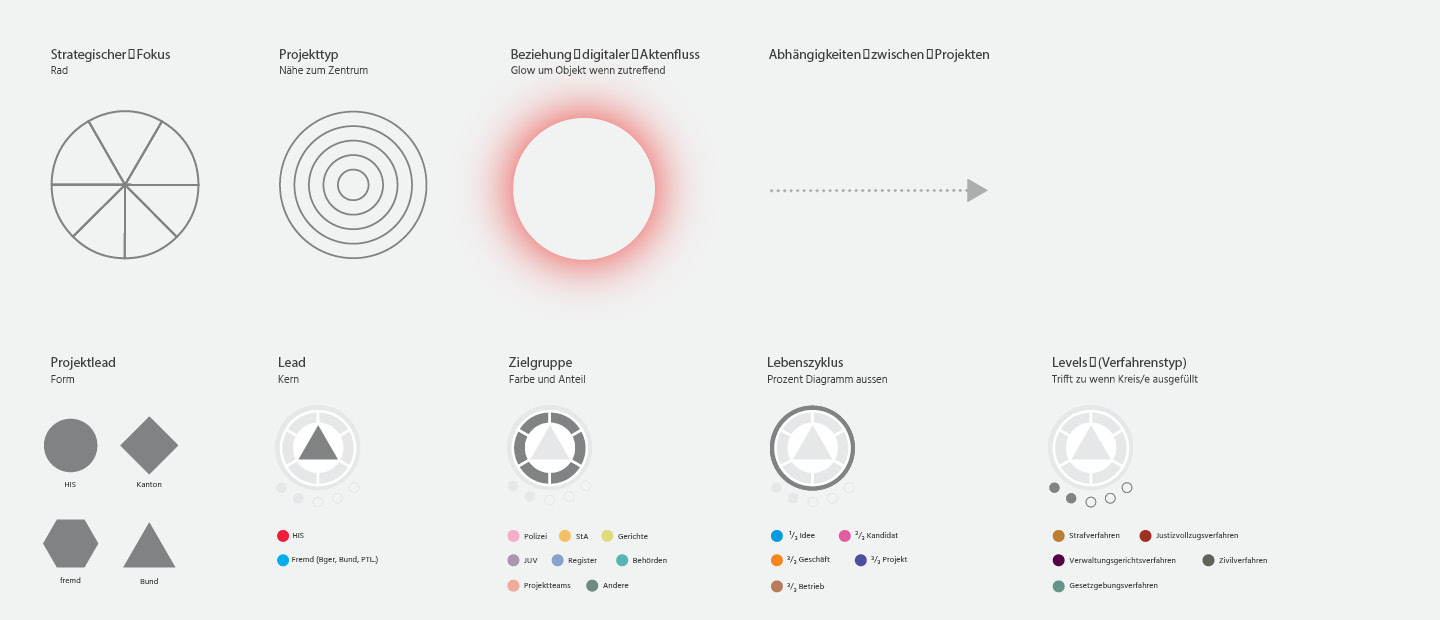
Our task was to make this data accessible, i.e. to create a design-driven logic.
Action
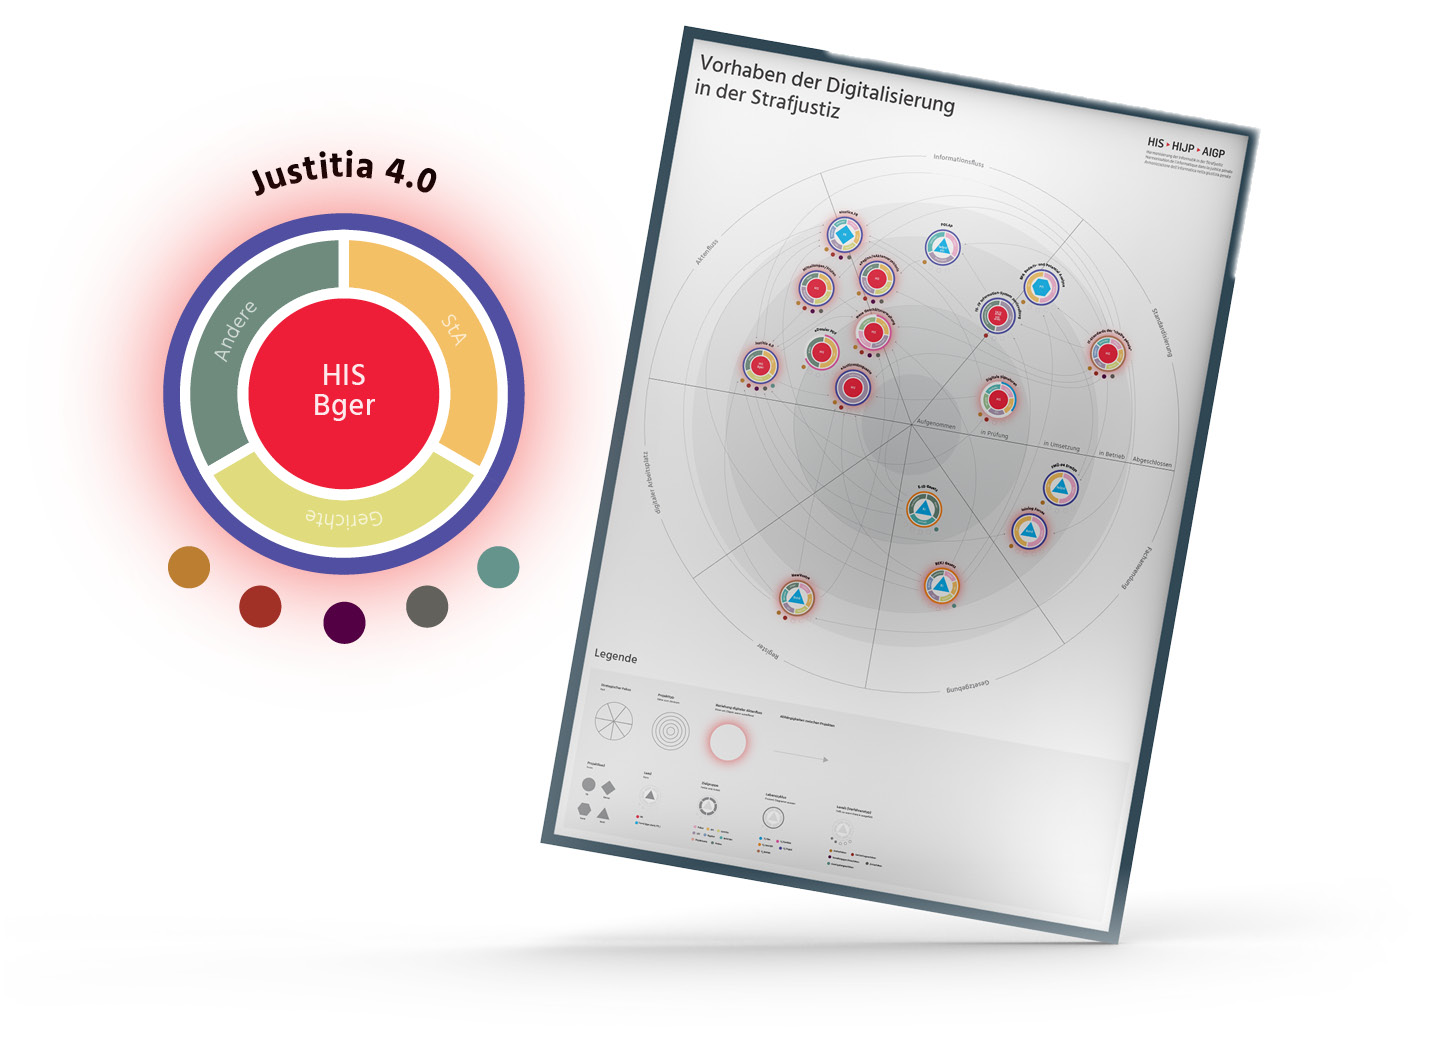
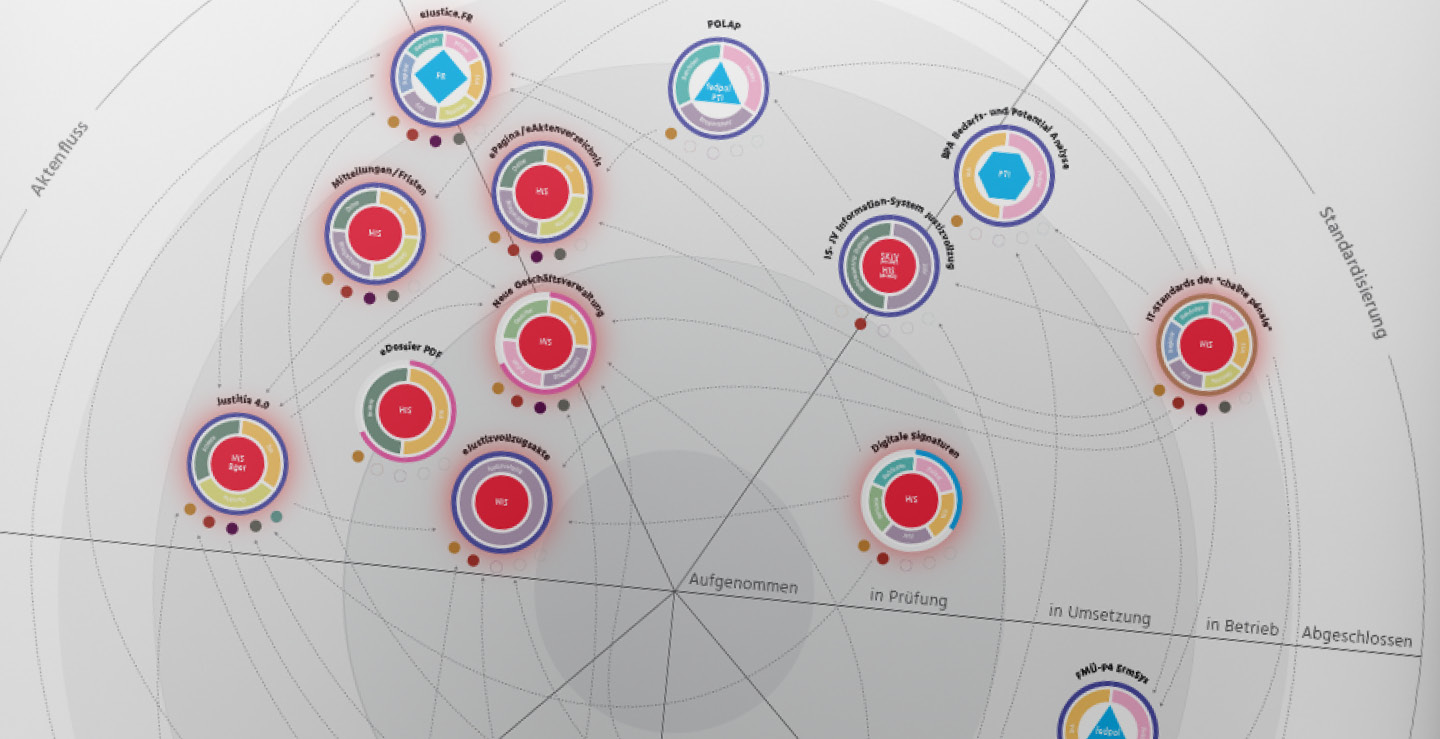
The data visualization was produced as a poster to provide HIS stakeholders with an overview.
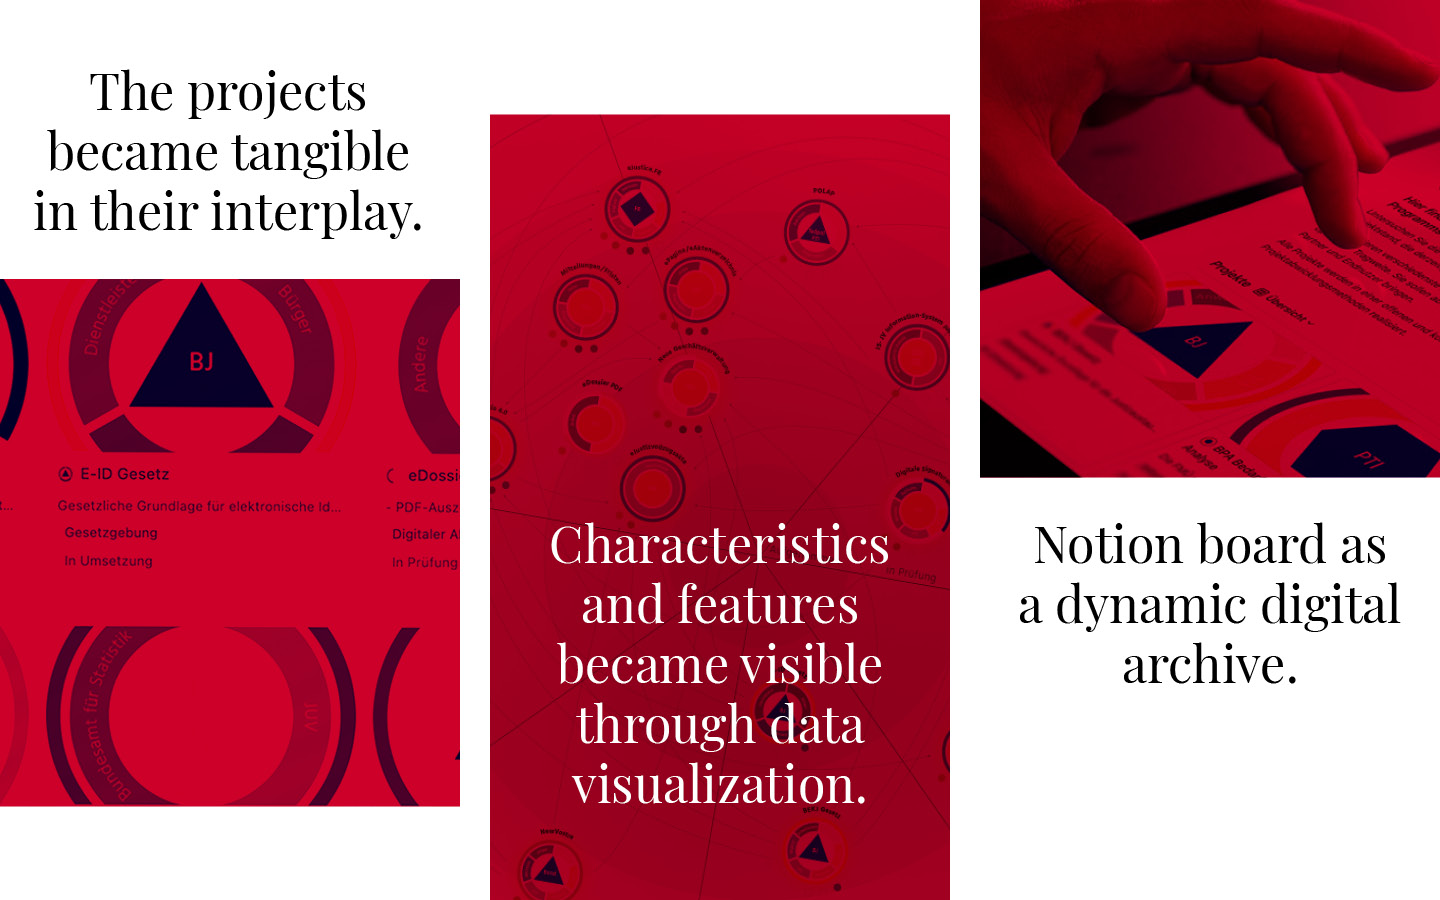
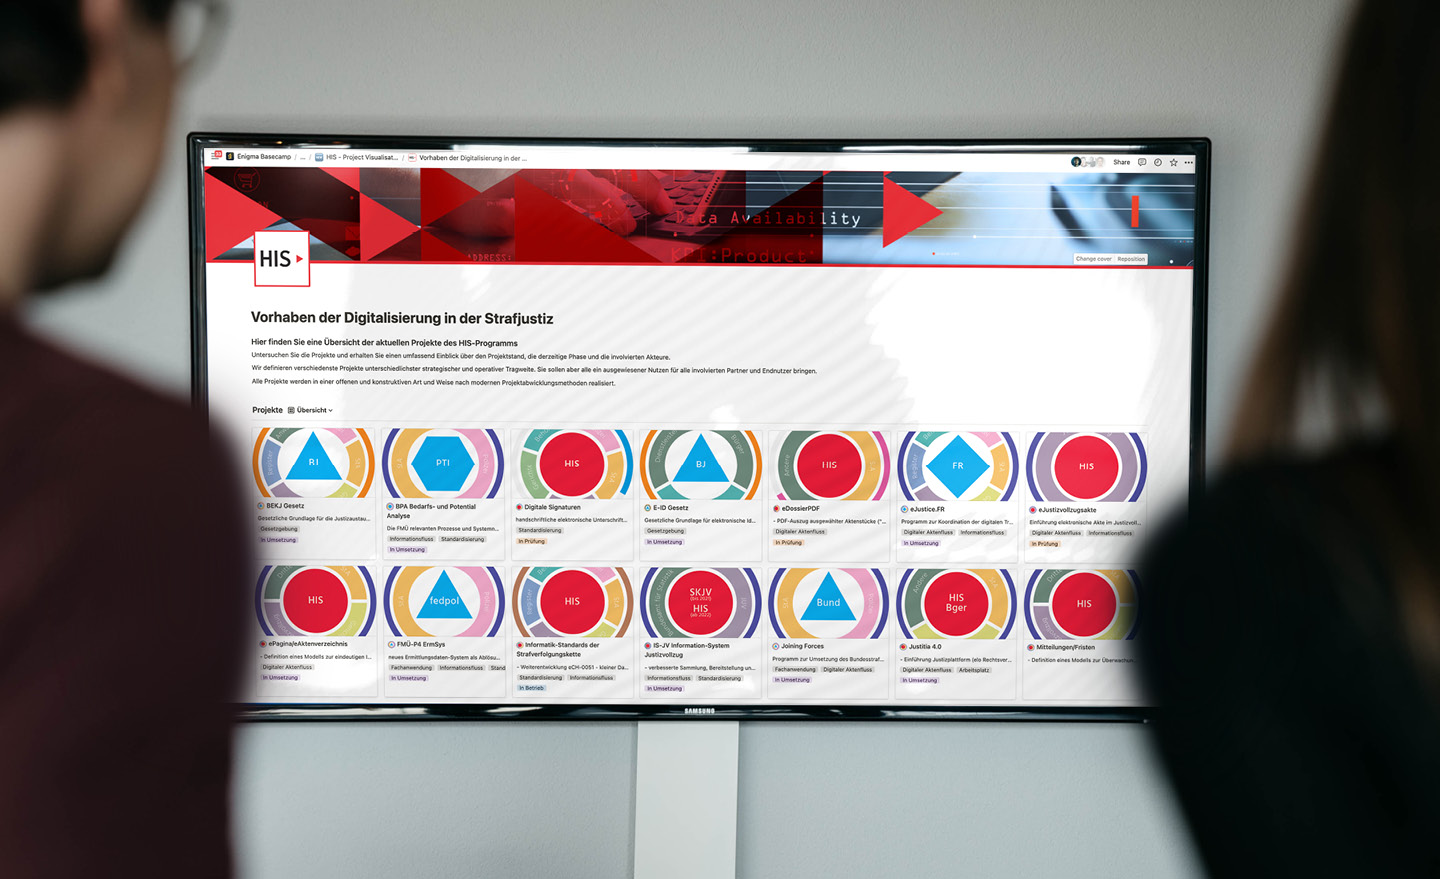
At the same time, we designed digital equivalents. In a notion board, projects are not just archived, they are available for dynamic further development and provide an up-to-date status at any time. Smart filters and links allow users to navigate through the projects.
Impact
- The projects of HIS became visible in their interplay for the first time.
- Their characteristics and features became visible through data visualization.
- We established a Notion board as a dynamic digital archive
« Enigma has helped us to make our work easily accessible. A complex Excel became something tangible, allowing us to explain our projects with their interrelationships, involvements and states to different stakeholders. »
– Dr. Jens Piesbergen – Program-Manager HIS, KKJPD

